Editorial
The Sales-Margin Transparency Farce
The current commercial blast between Black Friday and Christmas inspires me to explain the sales margin in a financial product and its transparence overlay-farce. Consumers are often led to think that zero-cost products are actually worth zero. As retail clients we are beginning to realize that filling an online survey at no cost with the potential to win a free-bee actually means that we are paying with our personal data rather than cash.
Now how does the sales-side make money with financial products, in particular with zero-cost strategies?
As an example we consider a UK-based corporate treasurer exporting to the US. He expects USD 1 M in 6 months and needs to convert it to GBP with the goal to maximize the GBP amount whilst being protected with a worst case exchange rate should cable rise, i.e. should GBP become more expensive in USD. She would like to use the current Brexit negotiations and the potential upcoming drop in cable, but lock in a worst case of 1.3000 USD per GBP. This means that a worst she will have GBP 796,231 in 6 months, but ideally, she will have more pounds.
We use the market data of 10 December of GBP-USD spot reference 1.2600, GBP 6-months money market rate 0.97%, USD 6-months money market rate 2.799%, 116 swap points, a 6-months forward rate of 1.2716, ATM volatility 13.744%, 25-delta risk reversal -2.774%, and 25-delta butterfly 0.363%. We visualize the smile in Figure 1using a purely educational parabolic interpolator on the forward delta space.
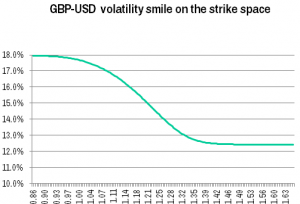
Figure 1: Volatility smile of Dec 10 2019 visualized
A bank offers the treasurer a standard currency hedging strategy called the risk reversal. In this strategy she buys a GBP call USD put with strike 1.3000, which represents her guaranteed worst case exchange rate in six months. To construct a zero-cost strategy she sells a GBP put USD call with strike 1.2400, which represents her best case. If the spot in 6 months trades between the best case and the worst case, she can sell her USD at the prevailing spot. If the spot trades above 1.3000, she has the right to sell her USD at 1.3000. If the spot trades below 1.2400, she is obliged to sell her USD at 1.2400.
This popular and common risk reversal strategy is offered to here at zero cost, so one may presume it is a fair transaction. With a spot reference of 1.2600, it doesn’t appear fair at first glance, but this is actually not a fair comparison, because the treasurer intends to sell the USD 1M in six months. The fair benchmark is the 6-months outright forward rate, which is 1.2716. Her best case is further away (316 pips) from this benchmark than her worst case (284 pips). Consequently, paying no premium for the strategy feels like the treasurer is getting a deal. However, looking at the volatility smile in Figure1, we spot that volatilities for lower strikes are much higher than for higher strikes. In fact, the GBP put USD call is valued with a volatility of 14.47%, whereas the GBP call USD put is valued with a volatility of 13.36%. By “valued” I mean that the mid-market volatility is used; I would used “priced” if either a bid- or offer volatility and sales margin were applied.
In reality, the FX options desk would quote prices for options to buy or sell, rather trading at the mid-market volatilities. In our example, the offer volatility for the GBP call USD put the treasurer wants to buy is 13.72%, implying an offer price of USD 27,886, and the volatility for the GBP put USD call the treasurer wants to sell is 14.11%, implying a bid price of USD 28,386. Since the latter bid price the treasurer would receive is USD 500 higher than the offer price of the former offer price the treasurer would need to pay, the overall offer price would be USD – 500, which is a negative number and means that the treasurer should receive USD 500 when trading the risk reversal strategy. Since she is offered the strategy at zero cost, which means that the treasurer neither pays nor receives anything for the strategy, the USD 500 can be considered the sales margin. The bank can then officially confirm that the sales margin for this strategy is USD 500, or 0.05% of the USD notional, or 5 basis points, which is reasonably competitive.
After the risk reversal is traded, and the trader adds it to his GBP-USD options portfolio, his portfolio value – after subtracting the USD sales margin that he owes his sales colleagues – goes up by USD 1,926, or 19 basis points. This can be interpreted in the way that bank actually locks in a total profit of 5+19=24 basis points, so USD 2,426 instead of USD 500. How does this comply with the requirement to state the sales margin in a transparent form? Well, as a matter of fact, complying with the rule is easy, but the actual figure one can state is arbitrary. In our case if could be any number between 0 and 24 basis points. This is because one could have split the sales margin differently: USD 1,500 for sales and the USD 926 difference between the offer price and the mid market value for the trading desk. In my experience, this price is the more realistic one in inter-bank trading, particularly, because the trader’s bid-offer for the second option is often reduced to zero, as his vega risk is reduced. In retail markets this is typically called “buy one – get one free”. As a conclusion we learn:
The listed “transparent” sales margin of a financial product complies with the rules, but is at best the minimum sales margin. It can be substantially higher.
As a matter of fact, the transparency imposed by regulation only helps politicians and regulators, but actually doesn’t add any value to the buy-side.
One might ask, how arbitrary the split between sales and trading profit is. In my opinion, this does not have a clear answer. The trader who warehouses his risk might – rightfully – argue that out of his 19 basis points sales margin he needs 15 to cover all his costs, and then only 4 basis points account for the actual profit. And then the question comes up, what actually counts as cost? This spectrum can be quite wide: from systems, to office rent and salaries, plus hedging costs in the interbank market. And since a risk-warehousing bank typically hedges its risk on a portfolio level, rather than for individual transactions, it is not at all clear, how much of this cost can actually be attributed to the single risk reversal strategy for our treasurer.
The second fact we learn is that any product that trades at zero cost, must have a negative initial market value, because the premium of zero is the offer price including all costs and all margins of all departments. And since the value marked to market (MTM) is between the bid and the offer price, the MTM must be negative.
Negative numbers are sometimes hard to understand, particularly if you drop out of school after second grade elementary school. You may remember the litigation of Ille Papier against Deutsche Bank in Germany, where Ille complained that in his ladder-swap, which the company had traded a zero cost in the beginning, generated negative coupons after the second year, and the judge made him win the case because the initial market value was apparently negative. This negative initial MTM mislead the judge to conclude that the swap was unfair.
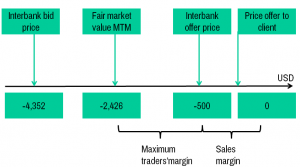
Figure 2: Typical bid-and offer prices of a zero-cost strategy
The buy-side has a way to find out how large the bid-offer spread is by asking the sell side also for the bid-price, i.e. how much they would have to pay if they wanted to unwind the strategy right after entering into it. We illustrate in Figure2 that immediately unwinding the risk reversal would cost the treasurer USD 4.352 (excluding sales margin).
As a matter of consistency, the politicians and regulators should come up with a law that requires any grocery store to make its profit on each carrot transparent to the clients. Some might find this completely insane. For financial products it has become a rule.
I would like to thank our readers, team, business partners and clients for the valuable impulses this year, wish you all a wonderful holiday season and good spirit for 2019.
Uwe Wystup
Managing Director of MathFinance
Upcoming Events
MATHFINANCE CONFERENCE 2019
Date: April 08 – 09, 2019
Venue: Frankfurt School of Finance & Management, Adickesallee 32-34, 60322 Frankfurt am Main
MathFinance Conference has been successfully running since 2000 and has become one of the top quant events of the year. The conference is specifically designed for practitioners in the areas of trading, quantitative and derivatives research, risk and asset management, insurance, as well as academics.
As always, we expect around 100 delegates both from the academia and the industry. This ensures a unique networking opportunity which should not be missed. A blend of world renowned speakers ensure that a variety of topics and issues of immediate importance are covered.
Our confirmed speakers for 2019 include:
- Prof. Griselda Deelstra (University of Brussels): tba
- Prof. Dr. Wolfgang Härdle (Humboldt University of Berlin): Pricing Cryptocurrency Options: the Case of CRIX and Bitcoin
- Junjie Hu (Humboldt University of Berlin): Realized Volatility Forecasting of Cryptocurrencies
- Prof. Dr. Karel in’t Hout (University of Antwerpen): Numerical Valuation of Bermudan Basket Options via Partial Differential Equations
- Dr. Antoine Jacquier (Imperial College London): VIX Options in Rough Volatility Models
- Vadim Kanofyev (Bloomberg): Machine Learning for Factor Investing
- Dr. Ingo Mainert (Allianz): TBA
- Maximilian Mair (Unicredit): Application of Machine Learning for Market Making
- Dr. Jacopo Mancin (Barclays Capital): Volatility Swaps: PDE Pricing Improvements for LSV Frameworks
- Dr. Alla Petukhina (Humboldt University of Berlin): Portfolio Optimization with Modified CoVar in Cryptocurrency Market
- Dr. Adil Reghai (Natixis): TBA
- Prof. Dr. Thorsten Schmidt (University of Freiburg and MathFinance): Statistical Arbitrage
- Daniel Schiemert (JP Morgan): TBA
- Dr. Martin Simon (Deka Invest): Stock Price Bubbles – An Option-based Indicator
- Dr. Niels Wesselhöfft (Humboldt University of Berlin): The Growth-Optimal Portfolio for Cryptocurrencies
- Prof. Dr. Uwe Wystup (MathFinance): TBA
Please click here for registration (single / group):
Single tickets are priced at our prime price of EUR 735 (+VAT) which ends on January 25, 2019.
Academics pay 525 EUR (+VAT) at all times. We kindly ask for proof of your affiliation.
Group prices (3 or more from the same institution) are at EUR 735 (+VAT) pp.
Discounted price of EUR 840 (+VAT) is valid from January 26 until February 21, 2019.
Regular price from February 22, 2019 is EUR 1.050 (+VAT).
Details of the conference can be found here.