Editorial
Payoff, P&L and Effective Exchange Rate Diagrams
Today, we go back to financial products 101 and discuss payoff, P&L and financial exchange rate diagrams. The reason is that I regularly experience confusion and misconception, thus it is time to clarify. Furthermore, there are reasons why different market participants look at financial products from a different angle.
As an example we consider a GBP call USD put option with strike K=1.3000. At university we learn how the payoff is visualized in a diagram. We put the GBP/USD spot ST (the price of a British pound in USD) at maturity on the x-axis and the payoff max(ST–K,0) on the y-axis. This is the payoff diagram in green shown in Figure 1, commonly referred to as the hockey-stick.
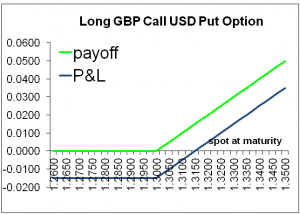
Figure 1: Payoff and P&L diagram of a GBP call USD put option
But then some people say, this doesn’t take into account the initial option premium. This is correct, but fully intended, as the payoff is a product feature – independent of its value. We can take the premium of 150 USD pips into account and plot a P&L-diagram in blue in Figure 1. This shows that the final spot price has to be 150 pips above the strike to break even, i.e. to recuperate at least the initial option premium from exercising the GBP call.
The P&L diagram is typically considered by investors, whereas the payoff diagram is used to understand the product, calculate the intrinsic value and the expected value, which will then lead to the option premium.
There is yet another illustration of the same GBP call, and this is of particular interest to a corporate treasurer, who uses the GBP call as a hedge to convert a USD amount into a GBP amount. This treasurer will want to know his Effective Exchange Rate, i.e. the rate that applies to his cash flow at maturity taking the GBP call into account. The treasurer has a worst case of 1.3000 USD per GBP. If GBP-USD ends up below this worst case, i.e. the strike of the GBP call, then he can sell USD in the spot market and let the option expire. His final exchange rate is hence equal to the spot. This is min(ST,K), exhibited in Figure 2.
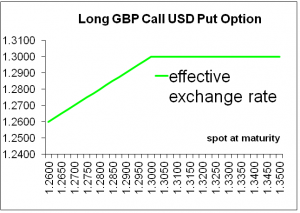
Figure 2: Effective Final Exchange Rate of a GBP call USD put with Strike 1.3000
This Effective Final Exchange Rate diagram looks like a short GBP put, but is actually a visualization of a long GBP call. All in all, we have three diagrams for the GBP call USD put that focus on different points of view.
And while we are at it, I often read and am told that short puts are less risky than short calls. Everybody normally agrees with this as for a short put, the crowd will agree that the loss of a put option is limited to the strike price, whereas the maximum potential loss of a call is infinite.
This is a suspicious lack of symmetry, isn’t it? To clarify, the FX view can help: The maximum potential loss depends on the currency in which you measure it. Consider the short GBP put USD call in Figure 3. Students – and market participants of other asset classes – typically put (unconsciously) USD on the y-axis and think that the loss is bounded by the strike price.
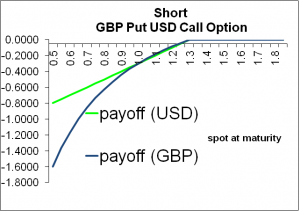
Figure 3: USD Payoff vs. GBP Payoff of a short GBP put USD call
However, if we measure the potential loss in GBP – and there are quite a number of banks with this approach in London – the payoff becomes –max(K-ST)/ ST, which converges to negative infinity as spot goes to zero, indicated by the blue curve.
Note that this payoff is just the one of a vanilla put, there is nothing exotic about it, and it is not a quanto put. It all comes back to my favorite question in FX markets: “which currency?”With GBP on the y-axis, the payoff of a vanilla put is no longer linear.
Your homework is to plot and compare the payoffs in USD and GBP of a short GBP call USD put, with the goal to find out that the maximum potential loss of a short GBP call is -1 GBP, i.e., finite when measured in GBP. This is rather intuitive, because the maximum you need to pay as an option writer is the call currency amount, which is 1 GBP. It is just not true that short calls are more risky than short puts.
Uwe Wystup
Managing Director of MathFinance
Upcoming Events
FX EXOTIC OPTIONS IN FRANKFURT 2018
December 10 – 12, 2018
Lecturer: Prof. Dr. Uwe Wystup
This advanced practical three-day course covers the pricing, hedging and application of FX exotics for use in trading, risk management, financial engineering and structured products.
FX exotics are becoming increasingly commonplace in today’s capital markets. The objective of this workshop is to develop a solid understanding of the current exotic currency derivatives used in international treasury management. This will give participants the mathematical and practical background necessary to deal with all the products on the market.
Learn more about the training or register directly.
MATHFINANCE CONFERENCE 2019
Date: April 08 – 09, 2019
Venue: Frankfurt School of Finance & Management, Adickesallee 32-34, 60322 Frankfurt am Main
MathFinance Conference has been successfully running since 2000 and has become one of the top quant events of the year. The conference is specifically designed for practitioners in the areas of trading, quantitative and derivatives research, risk and asset management, insurance, as well as academics.
As always, we expect around 100 delegates both from the academia and the industry. This ensures a unique networking opportunity which should not be missed. A blend of world renowned speakers ensure that a variety of topics and issues of immediate importance are covered.
Our confirmed speakers for 2019 include:
- Prof. Griselda Deelstra (University of Brussels): tba
- Prof. Dr. Wolfgang Härdle (Humboldt University of Berlin): Pricing Cryptocurrency Options: the Case of CRIX and Bitcoin
- Junjie Hu (Humboldt University of Berlin): Realized Volatility Forecasting of Cryptocurrencies
- Prof. Dr. Karel in’t Hout (University of Antwerpen): Numerical Valuation of Bermudan Basket Options via Partial Differential Equations
- Dr. Antoine Jacquier (Imperial College London): VIX Options in Rough Volatility Models
- Vadim Kanofyev (Bloomberg): Machine Learning for Factor Investing
- Dr. Ingo Mainert (Allianz): TBA
- Maximilian Mair (Unicredit): Application of Machine Learning for Market Making
- Dr. Jacopo Mancin (Barclays Capital): Volatility Swaps: PDE Pricing Improvements for LSV Frameworks
- Dr. Alla Petukhina (Humboldt University of Berlin): Portfolio Optimization with Modified CoVar in Cryptocurrency Market
- Dr. Adil Reghai (Natixis): TBA
- Prof. Dr. Thorsten Schmidt (University of Freiburg and MathFinance): Statistical Arbitrage
- Daniel Schiemert (JP Morgan): TBA
- Dr. Martin Simon (Deka Invest): Stock Price Bubbles – An Option-based Indicator
- Dr. Niels Wesselhöfft (Humboldt University of Berlin): The Growth-Optimal Portfolio for Cryptocurrencies
- Prof. Dr. Uwe Wystup (MathFinance): TBA
Please click here for registration (single / group):
Single tickets are priced at our prime price of EUR 735 (+VAT) which ends on January 25, 2019.
Academics pay 525 EUR (+VAT) at all times. We kindly ask for proof of your affiliation.
Group prices (3 or more from the same institution) are at EUR 735 (+VAT) pp.
Discounted price of EUR 840 (+VAT) is valid from January 26 until February 21, 2019.
Regular price from February 22, 2019 is EUR 1.050 (+VAT).
Details of the conference can be found here.